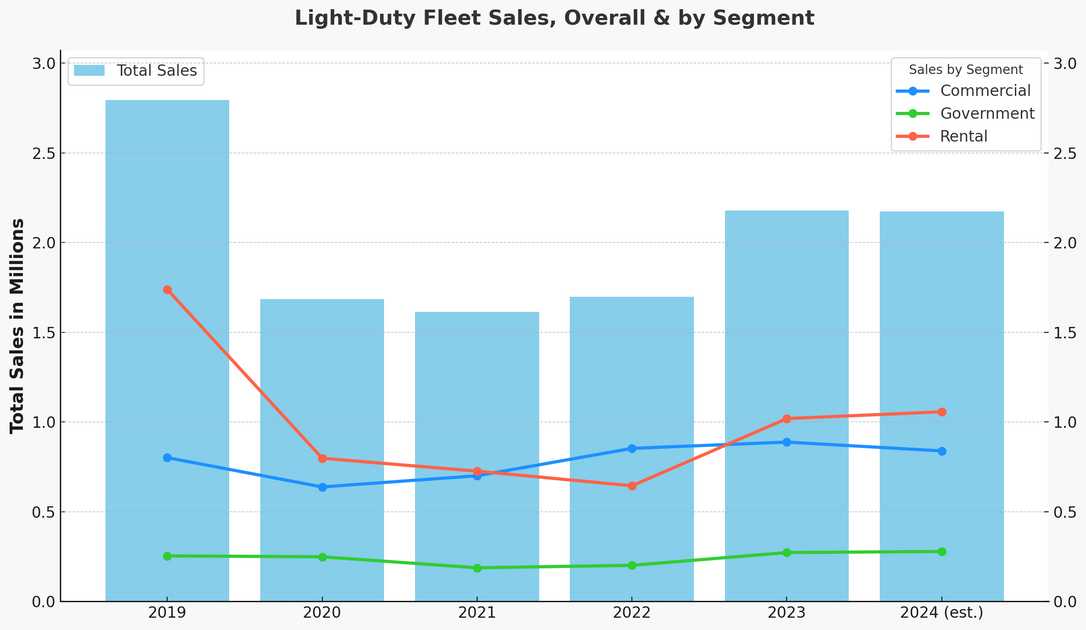
While 2023 could be called the “recovery year” for fleets, sales are leveling off — or trending down slightly — in 2024. This is an AI-generated image for informational purposes only. Refer to our Terms of Use.
Data from Bobit Research demonstrates light-duty fleet sales from the last “normal” year before the COVID-19 pandemic and through projected sales for 2024. It’s a tale of three fleet segments: commercial, government, and rental.
Commercial Sales Trending Under 2023
Commercial fleet sales experienced the same severe supply issues as the fleet market overall. However, commercial sales during and exiting the pandemic were driven by the acute need for trucks and vans in areas such as construction and particularly in package delivery.
Commercial fleets largely compensated for the lack of vehicle availability in 2021 and 2022 with their 2023 purchases. Sales in 2024 have been consistently under 2023 on a monthly basis through July. This trend should continue through 2025.
| Total Yearly Fleet Sales | |||
|---|---|---|---|
| 2019 | 2023 | 2024 Est. | |
| Commercial | 801,251 | 884,204 | 838,942 |
| Rental | 1,738,993 | 1,019,225 | 1,057,073 |
| Government | 253,771 | 272,403 | 278,373 |
Source: Bobit Research
Rental Sales Substantially Under 2019
Rental — which commands nearly half of all fleet sales that are dominated by passenger cars — suffered the largest pandemic drop from 2019 through 2022 as manufacturers prioritized more profitable retail sales.
Rental companies adjusted to smaller fleet sizes with longer lengths of service for rental vehicles. The big rebound year for rental was 2022 to 2023, when sales increased by 58%.
Ironically, though market watchers have recently labeled the rental market as “over-fleeted,” yearly sales figures for rental in 2024 will be at least 40% lower than those for 2019.
Government Sales Revert to Normal Patterns
Government fleets experienced their sales drought later, in 2021, though on much smaller volumes than the other fleet segments.
This may have been a function of longer vehicle holds, the specialized nature of vehicle builds, and the contract and bidding process specific to government fleets.
In terms of government fleets’ recovery, many agencies were allowed to bypass those contracts to buy directly from local dealers. Moving into 2024 and beyond, purchase methods have reverted to normal patterns.
Fleet Sales Trends & Projections
While 2023 could be called the “recovery year” for fleets, sales have been on par or trending slightly down month to month in 2024 to date.
Based on 2024 sales through July, Automotive Fleet predicts that overall fleet sales will equal or fall slightly shy of 2023 sales, though will still lag 22% behind total sales in 2019.
Trends show that government fleet sales should equal or slightly surpass 2023 sales, while also surpassing 2019 totals.
Commercial fleet sales for 2024 are trending lower than 2023, though they will still come in above 2019.
This moderation of sales roughly reflects the overall market, as NADA data shows that new light-vehicle sales in July 2024 had a SAAR (seasonally adjusted annual rate) of 15.8 million units, down 0.8% year-over-year.

